Based on the video, the 78 to 80 basis point drop refers to the total decline in the 2-year Treasury yield over the course of the full year 2025 [01:20].
Here is the breakdown of the comparison:
- Current Level (End of 2025): The 2-year yield is at 3.46% [01:20].
- Comparison Point: This is compared to where the yield started at the beginning of 2025.
- The Math: While Rick Santelli doesn’t explicitly state the starting percentage, a 78–80 basis point drop from a current 3.46% implies that the 2-year yield began the year 2025 at approximately 4.24% to 4.26%.
Similarly, he notes the 10-year yield is at 4.13%, which is down 45 to 46 basis points for the year 2025 [01:30].
| Date | 2-Year Yield Rate | Change (Basis Points) |
| January 2, 2025 | 4.25% | Start of Year |
| December 31, 2025 | 3.46% – 3.47% | -78 to -79 bps |
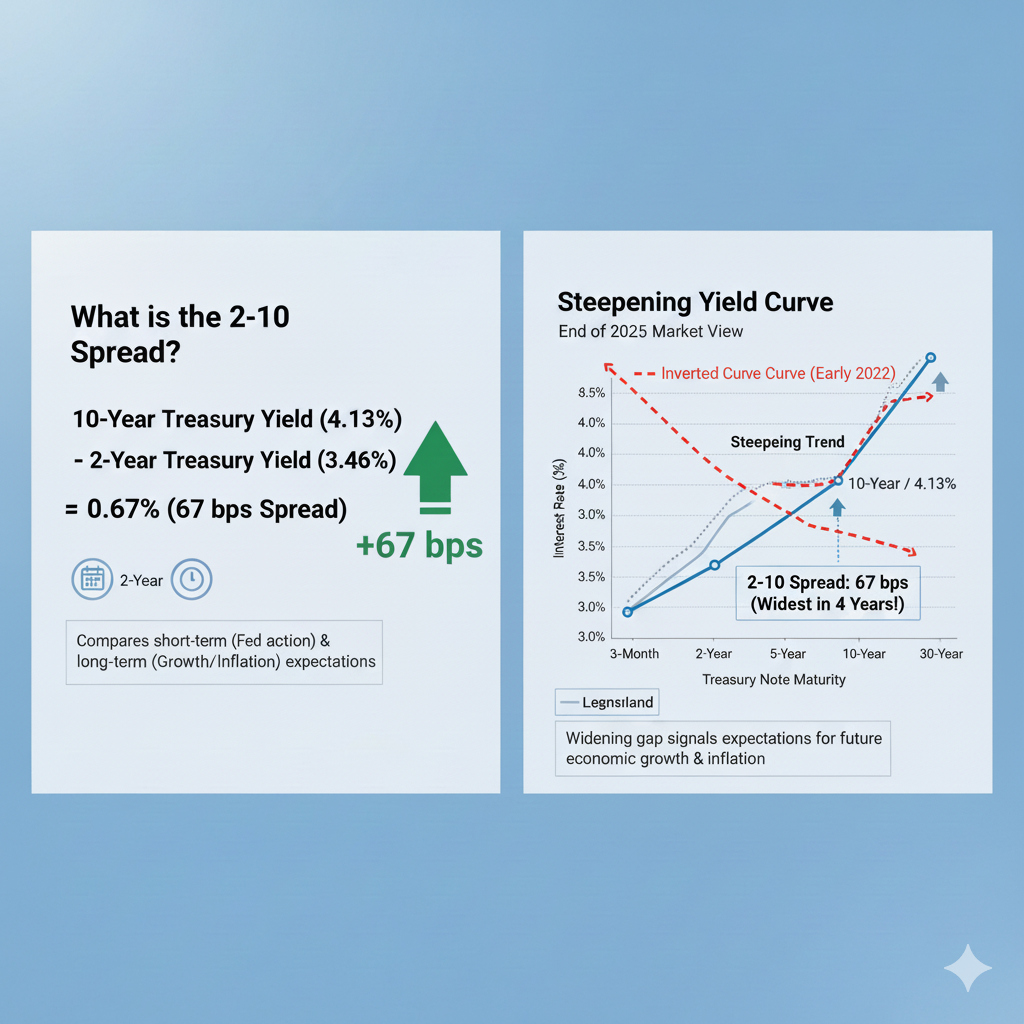
In financial terms, the “2-10 spread” is the difference in interest rates (yields) between the 10-year Treasury note and the 2-year Treasury note.
It is a primary way investors measure the “shape” of the yield curve, which acts as a health check for the economy. In the video, Rick Santelli explains it as follows:
1. The Calculation
The spread is calculated by subtracting the 2-year yield from the 10-year yield:
- 10-Year Yield: 4.13% [01:30]
- 2-Year Yield: 3.46% [01:20]
- The Spread: 67–68 basis points (0.68%) [01:45]
2. Why it Matters in the Video
Santelli notes that this 68-basis-point gap is the widest in four years, dating back to January 2022 [01:45]. He uses this to highlight two specific market conditions:
- Steepening Yield Curve: A “normal” or “steep” curve is when long-term rates (10-year) are significantly higher than short-term rates (2-year). This usually suggests investors expect the economy to grow and inflation to potentially rise in the future [02:07].
- Federal Reserve Uncertainty: He mentions that the Fed is currently “going in different directions” [01:59]. Some members are worried about inflation, while others are forecasting interest rate cuts (eases) in 2026. This tug-of-war is what is pushing the 2-year yield down faster than the 10-year, causing the spread to widen [02:07].
3. Why Traders Watch It
- Positive Spread (Normal): Indicates a healthy outlook where you are paid more to lock your money away for a longer period (10 years vs. 2 years).
- Negative Spread (Inverted): If the 2-year yield were higher than the 10-year, the spread would be negative. This is known as an “inverted yield curve,” which is historically a very reliable warning sign that a recession is coming.
It is definitely the “2-10 spread” (referring to the 2-year and 10-year Treasury notes), even though it sounds like “two-ten” when spoken quickly.1
In the world of finance, traders almost never say “two dash ten”; they just say “the two-tens” or “the two-ten spread.” Here is why that specific pair is the “gold standard” for market analysis:
1. It’s a Comparison of Time
- The 2-Year: Reflects what the market thinks the Federal Reserve will do with interest rates in the near future.
- The 10-Year: Reflects the market’s outlook on long-term growth and inflation.
2. The Calculation (The “Spread”)
When Rick Santelli says the spread is 68 basis points, he is doing a simple subtraction:
$$10\text{-Year Yield} (4.13\%) – 2\text{-Year Yield} (3.46\%) = 0.67\% \text{ (or 67–68 bps)}$$
3. Why it’s a Big Deal in this Video
For most of 2023 and 2024, this spread was negative (the 2-year yield was higher than the 10-year). This is called an inverted yield curve.
By the end of 2025, Santelli is getting excited because:
- The curve is no longer inverted.
- The gap is widening (steepening).
- At 68 points, the “10-year” is now significantly more expensive than the “2-year,” which usually signals that the market believes the economy is returning to a more “normal” state.